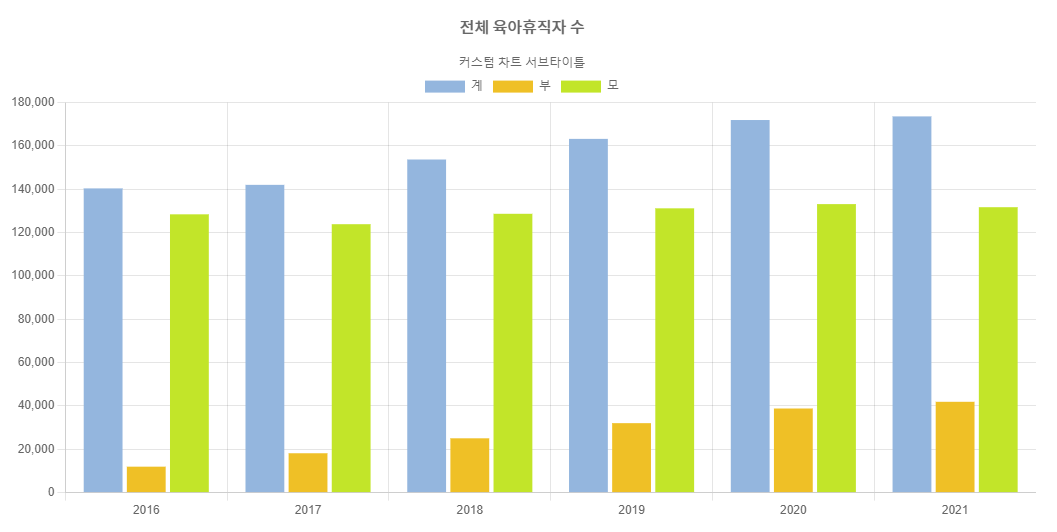
chart.js 으로 간단한 차트 만들기
데이터
외부 json 파일을 불러오기 함
※ 통계 출처 : 통계청 - 전체 육아휴직자 수
{
  "items": [
    {
      "year": 2016,
      "total": 140403,
      "father": 11965,
      "mother": 128438
    },
    {
      "year": 2017,
      "total": 142038,
      "father": 18160,
      "mother": 123878
    },
    {
      "year": 2018,
      "total": 153741,
      "father": 25062,
      "mother": 128679
    },
    {
      "year": 2019,
      "total": 163256,
      "father": 32051,
      "mother": 131205
    },
    {
      "year": 2020,
      "total": 171959,
      "father": 38813,
      "mother": 133146
    },
    {
      "year": 2021,
      "total": 173631,
      "father": 41910,
      "mother": 131721
    }
  ]
}
코드
  <!-- 차트 그리는 영역 -->
  <div>
    <canvas id="myChart"></canvas>
  </div>

  <!-- chart.js CDN -->
  <script src="https://cdn.jsdelivr.net/npm/chart.js"></script>

  <!-- chart.js customize -->
  <script>
  //데이터 불러오기
  fetch('./chart-tutorial-data.json')
  .then( res => res.json() )
  .then( data => {
    // console.log(data.items);
    const chartdata = data.items;
    const ctx = document.getElementById('myChart');

    new Chart(ctx, {
      type: 'bar', //bar | line | doughnut | bubble | polarArea | radar | scatter
      data: {
        labels: chartdata.map(item => item.year),
        datasets: [
          {
            label: '계',
            // data: [142038, 153741, 163256, 171959, 173631],
            data: chartdata.map(item => item.total),
            borderWidth: 0,
            backgroundColor:'#94B6DE',
            color:'#000',
          },
          {
            label: '부',
            data: chartdata.map(item => item.father),
            borderWidth: 0,
            backgroundColor:'#efc026'
          },
          {
            label: '모',
            data: chartdata.map(item => item.mother),
            borderWidth: 0,
            backgroundColor:'#c2e529'
          }
        ]
      },
      options: {
        scales: {
          x:{
            // type: 'time'
          },
          y: {
            beginAtZero: true,
          }
        },
        animation:true, //true | false
        tooltip:{
          enabled: false
        },
        plugins:{
          title:{
            display:true,
            text:'전체 육아휴직자 수', //string
            align:'center', //start | center | end
            padding: {
              top: 10,
              bottom:20
            },
            font:{
              family: "'Noto Sans KR', sans-serif",
              weight:'normal', //normal | bold
              size: '16',
              lineHeight: 1.2
            }
          },
          subtitle:{
            display:true,
            text:'커스텀 차트 서브타이틀'
          }
        }
      }
    });

  })
  .catch( (error) => { console.log(error) })
  </script>
결과물

반응형
'웹 개발 > JavaScript' 카테고리의 다른 글
| [jquery]rwdImageMaps.js-반응형 이미지 맵 플러그인 (0) | 2023.04.05 |
|---|---|
| [jQuery]maphilight.js - map태그 마우스오버할 때 강조 효과 나타내는 플러그인 (0) | 2023.04.05 |
| [JS]chart.js - 차트만드는 자바스크립트 라이브러리 (0) | 2022.07.12 |
| [JS]three.js - 3D 자바스크립트 라이브러리 (0) | 2022.07.12 |
| [jQuery] jQuery 슬라이드 라이브러리 (0) | 2021.07.25 |

댓글